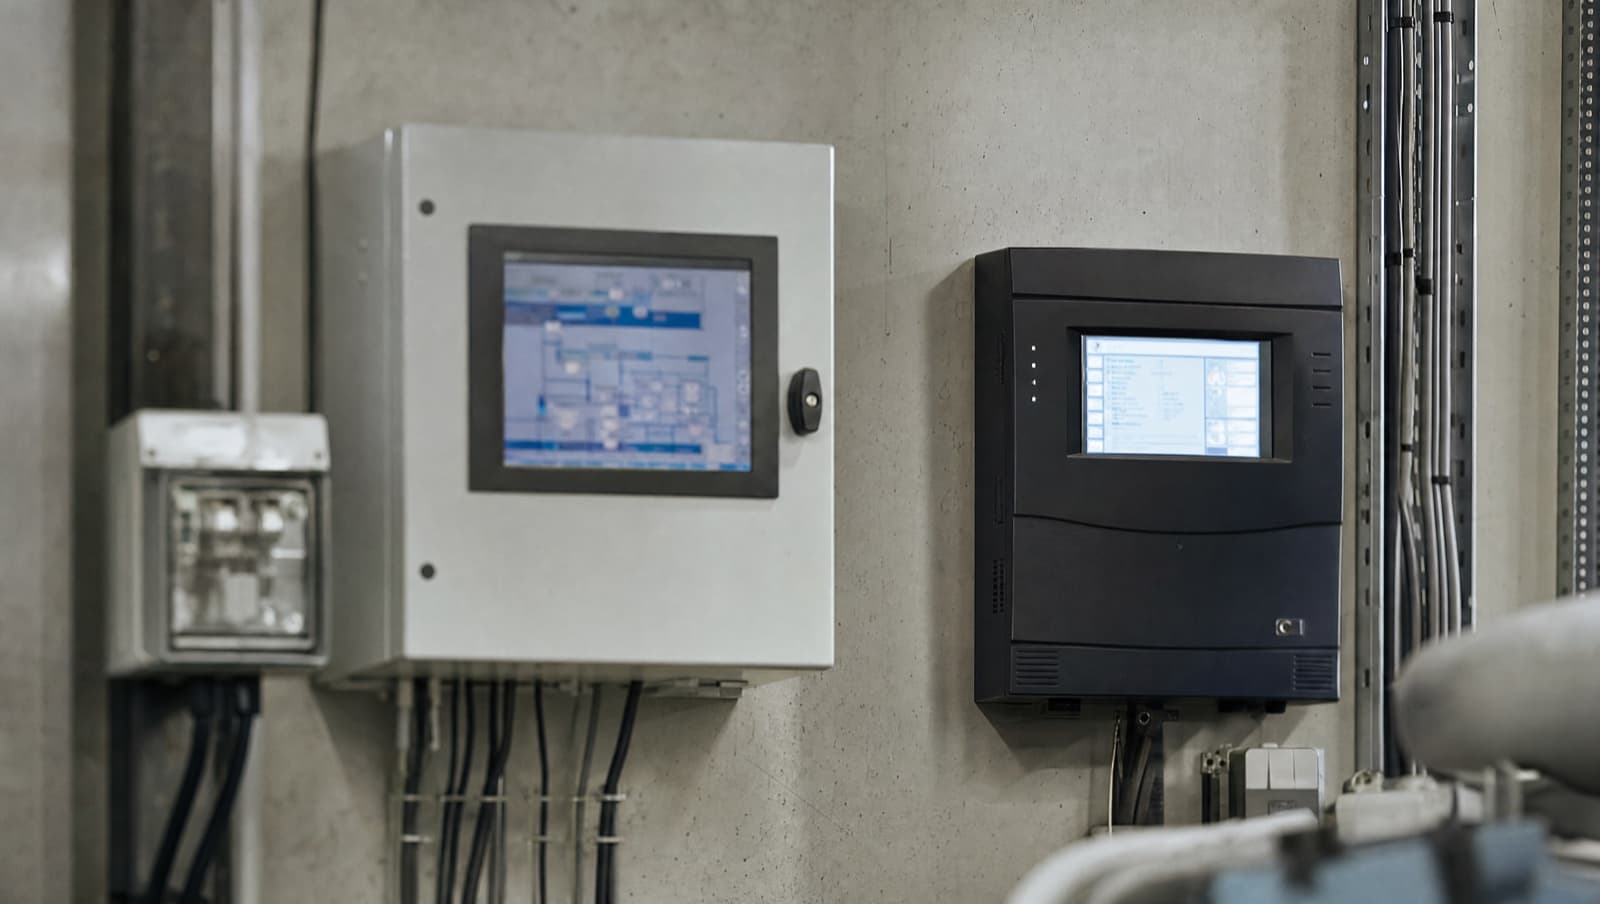

Siemens Desigo CC is an open building management platform that aggregates HVAC, lighting, fire, security and metering data from across an estate into one front end. The catch is it captures far more data than most FM teams use. Value comes from configuring focused dashboards, trends and reports around real operational decisions, not raw point volume.
Walk into a plant room with a Desigo CC head end running and you will usually find the same thing: a beautifully detailed system that nobody is really driving. The graphics are crisp, the point count is enormous, every valve and damper is there on screen. Then you ask the FM team which three numbers they look at on a Monday morning, and you get a shrug. That is the real problem with Desigo CC. It is technically impressive and, on a lot of sites, practically useless because the data was never shaped into something a human can act on.
What is Siemens Desigo CC and what does it actually do?
Desigo CC is Siemens' building management and operational technology platform. It sits above field-level controllers, your Siemens PXC automation stations, third-party plant on BACnet, Modbus devices, OPC sources and increasingly IP-connected kit, and presents the whole lot through one operator station. It speaks BACnet/IP and BACnet MS/TP natively, which matters because the BACnet data model is defined by BS EN ISO 16484-5 (the same standard published as ASHRAE 135). That standard sets out how objects, properties and services are structured, so a temperature point from a Siemens controller and one from a third-party AHU should both present consistently in the front end.
The platform handles graphics, alarm management, trend logging, scheduling, reporting and access control across multiple buildings. On a large estate that consolidation is genuinely useful: one screen instead of five legacy head ends. But Desigo CC is a tool, not a strategy. Out of the box it will happily log thousands of points at short intervals and alarm on anything you let it. What it will not do is decide what matters to your building. That part is down to whoever commissions and configures it, and it is the part that gets skipped most often.
Why does Desigo CC produce so much data that nobody uses?
Because logging a point is cheap and deciding what to do with it is expensive. When a system is engineered, it is far quicker to enable trend logs on everything than to sit down with the operator and work out which trends support a decision. So the default ends up being maximum coverage: every space temperature, every valve position, every status point, all sampled frequently and retained for months.
The result is a head end that is data-rich and information-poor. There is a difference. Data is the raw value sitting in a log. Information is the value put in context, against a setpoint, a time schedule, a design intent or last week's behaviour, so it tells you something. CIBSE Guide H, the guidance for building control systems, is clear that controls should serve the operational and energy objectives of the building. A wall of unfiltered points serves nobody. The team learns to ignore the screen, and genuine faults get lost in the noise. Once people stop trusting the front end, the most expensive system on site becomes wallpaper.
What goes wrong with Desigo CC dashboards and alarms on site?
The most common failure we see is alarm flooding. Every point gets an alarm enabled with no priority structure, so a critical chilled water flow failure lands in the same list as a single FCU running a degree off setpoint. When everything alarms, nothing is an alarm. Operators silence the lot, and the one notification that mattered gets acknowledged and forgotten alongside three hundred nuisance events.
The second issue is trend logs configured without a question to answer. You will find a point logged every thirty seconds for two years that no one has ever opened, while the trend you actually need, supply versus return temperature on a heating circuit over a cold snap, was never set up. Then there is graphics drift: the system was commissioned accurately, but a heat pump got swapped, a zone was re-partitioned in a refurb, a sensor was relocated, and the front end was never updated. Now the screen shows a plant arrangement that no longer matches the building, and any data accuracy argument falls apart at the first point.
Underlying a lot of this is poor point naming and inconsistent units pulled in from third-party BACnet devices. If a borrowed point arrives as a raw integer with no engineering unit or a cryptic tag, it is technically present and practically meaningless. Multiply that across a multi-building estate and the consolidated Desigo CC front end becomes harder to read than the five systems it replaced.
Get a Free BMS Survey
We'll assess your controls and provide a detailed quotation.
How do you configure Desigo CC dashboards and reports that matter?
Start with the decisions, not the points. Sit down with the people who run the building and ask what they need to know each morning, each week, and when something goes wrong. Out of that you get a short list of operational questions: is every zone hitting setpoint, is plant sequencing correctly, are time schedules matching occupancy, is energy tracking where it should. Then you configure dashboards to answer those questions and nothing else. Everything else stays available in the system but off the front page.
Alarms need a priority hierarchy: critical (plant down, safety, flow failure), high (comfort at risk, equipment running outside limits) and low or maintenance (informational, drift, runtime thresholds). Critical alarms should be few and trustworthy enough that an operator acts the moment one appears. Trends should be set up against the questions that recur: setpoint versus actual, valve position over time to spot hunting or stuck valves, supply and return temperatures to confirm plant is doing real work. Reporting should roll up to something a non-engineer can read, a weekly energy and comfort summary, rather than a raw point dump.
This is also where energy performance gets real. CIBSE TM54, the methodology for evaluating operational energy use, expects you to compare actual in-use consumption against design intent. Desigo CC holds the metering and plant data to do exactly that, but only if the trends and reports are structured around that comparison. Configured well, the same platform that was wallpaper becomes the evidence base for finding waste, proving savings and supporting MEES compliance.
When should you bring someone in to sort out a Desigo CC system?
If your operators have stopped looking at the front end, that is the signal. So is a constantly full alarm list, graphics that no longer match the plant, or being unable to answer a simple question like how much energy a building used last month without exporting raw data and wrestling it in a spreadsheet. None of these need a rip-and-replace. Desigo CC is a strong platform, the issue is almost always configuration and handover, not the software.
This usually traces back to commissioning. BSRIA BG 11/2010, the Soft Landings framework, exists precisely because systems get handed over technically complete but operationally unusable, with no one trained on what to actually watch. A proper review re-prioritises alarms, rebuilds dashboards around real decisions, corrects graphics and naming, prunes pointless trends and adds the ones you need, then sits with the FM team so they trust the screen again. On a multi-building estate that work typically pays for itself in found energy waste and faults caught early.
Desigo CC will give you more data than you know what to do with. That is not a fault, it is the platform doing its job. The skill is turning that firehose into a handful of dashboards, alarms and reports that a busy FM team can act on without thinking twice. If your Desigo CC head end has quietly become wallpaper, get in touch and we will help you turn it back into a tool. You can also request a quote for a configuration and commissioning review across your estate.
Darren Grix
Specialist BMS installation, commissioning, and maintenance across London and the South East. SafeContractor Approved, BCIA Member.